New York City's subway fare evasion enforcement has long been scrutinized for racial disparities. This study links 4,211 individual-level arrest records from two public defender datasets to subway ridership, neighborhood poverty rates, and reported crime data across 157 Brooklyn stations in 2016, to examine whether enforcement intensity varies systematically by neighborhood racial composition and poverty.
Two public defender microdata sources were merged, cleaned, and harmonized: the Brooklyn Defender Services (BDS) dataset with 2,246 records and the Legal Aid Society (LAS) dataset with 1,965 records. Race and ethnicity were recoded into a consistent taxonomy across both sources, yielding a unified classification with mutually exclusive categories.
Arrest records were aggregated to the station level and joined to MTA ridership data, census-tract poverty rates, and NYPD criminal complaint counts. The key outcome variable is fare-evasion arrest intensity (arrests per 100,000 ridership), which normalizes enforcement activity by station usage. Observations were weighted by ridership to account for the wide variation in station size. Coney Island-Stillwell Avenue was dropped due to its atypical ridership profile as a beach destination.
High-poverty station areas show significantly higher arrest intensity (1.42 arrests per 100,000 riders) compared to low-poverty areas (0.78). The difference of 0.63 is statistically significant (p = 0.002), and grows sharply for majority-Black station areas at high poverty levels (2.49 vs. 0.82).
The relationship between poverty and enforcement intensity is non-linear. A weighted quadratic OLS model significantly outperforms the linear specification (adjusted R² = 0.21 vs. 0.15; p = 0.006 for the quadratic term), capturing the pattern that enforcement increases more steeply at higher poverty levels.
Crucially, this poverty gradient varies sharply by neighborhood racial composition. An interaction model (poverty rate × majority-Black indicator) reveals a statistically significant interaction term (p < 0.001), with the poverty-to-arrest slope nearly four times steeper in majority-Black station areas than in majority non-Black areas.
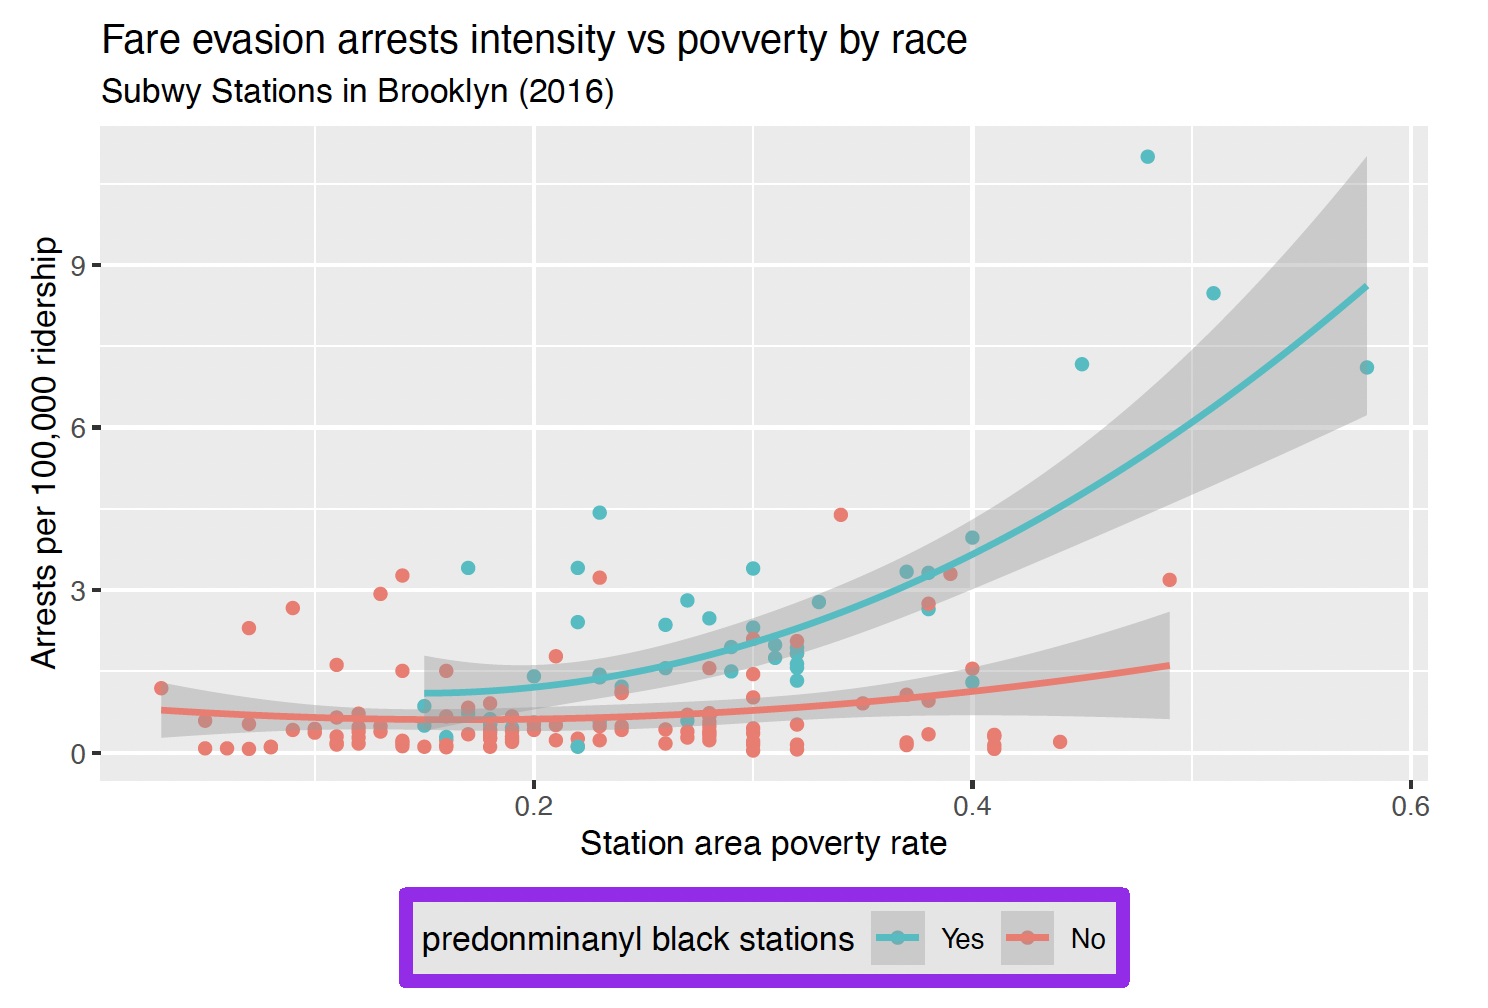
Fare evasion arrest intensity vs. station area poverty rate by neighborhood racial composition, Brooklyn subway stations (2016). The teal line (majority-Black stations) rises sharply with poverty, while the red line (majority non-Black) remains nearly flat — a pattern confirmed by a statistically significant interaction term (p < 0.001).
After excluding observations with missing race/ethnicity data, Non-Hispanic Black individuals account for 50% of arrests and Hispanic individuals for 29%. Combined, Black and Hispanic clients represent 79% of arrests, despite making up a smaller share of the broader population.
Among the top stations by arrest volume, the Black and Hispanic share ranges from 64% at Marcy Ave to 100% at Rockaway Ave (3 line), indicating highly concentrated enforcement in communities of color even after accounting for poverty and crime levels.
A separate analysis tested whether reported crime levels could explain the observed disparities. While there is a positive and statistically significant association between crime and arrest intensity (quadratic model, adjusted R² = 0.11), the interaction between crime and neighborhood racial composition is not statistically significant, suggesting that crime levels do not fully account for the racial gradient in enforcement. The poverty-based model retains stronger explanatory power.
These results are observational and cannot establish causal bias in enforcement decisions. Several limitations apply: the data cover only 2016 in Brooklyn; demographic proxies from surrounding census tracts may systematically underestimate the diversity of ridership at busy commuter hubs; and key variables such as officer deployment schedules and station design are unavailable. Future research should incorporate patrol-level data and test robustness across racial composition thresholds.
The findings are nonetheless consistent with the hypothesis that fare-evasion enforcement in Brooklyn's subway system in 2016 was disproportionately concentrated in high-poverty, majority-Black neighborhoods, beyond what poverty rates or crime levels alone would predict.