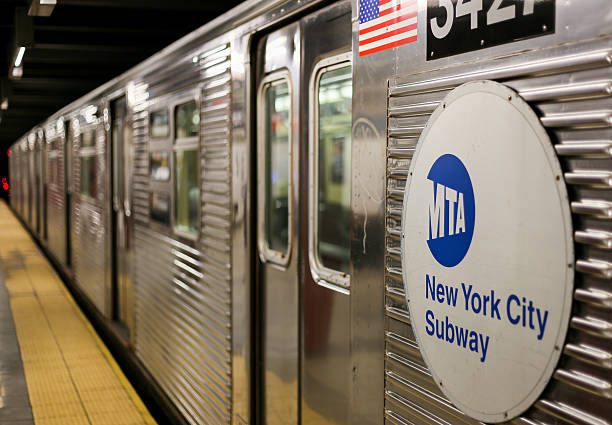
The spatial distribution of subway stations in New York City is highly uneven. Stations are heavily concentrated in Manhattan and along major corridors in Brooklyn, Queens, and the Bronx — reflecting a century of transit development built around Manhattan-bound commuting rather than citywide equity.
The density of stations in Manhattan is particularly high, creating overlapping 0.5-mile buffers that indicate extensive accessibility to rapid transit. In contrast, outer borough areas such as eastern Queens, southern Brooklyn, and much of Staten Island have significantly fewer stations — more spatially dispersed and farther from subway infrastructure.
The analysis reveals a strong relationship between subway access and population density. The highest density census tracts are concentrated in Manhattan and parts of western Brooklyn and the Bronx — the same areas with the greatest concentration of subway stations. This suggests that transit infrastructure has historically been developed to support already dense urban environments and high commuting demand.
However, several moderately dense neighborhoods in outer boroughs appear to have fewer subway stations, indicating potential gaps between residential density and transit availability that are not captured by density alone.

Population Density and Proximity to Subway Stations in New York City. Orange dots represent subway stations; green shading indicates population density by census tract. Source: ACS data via Social Explorer.
Census tracts located 0.5 miles or more from the nearest subway station are concentrated in eastern Queens, southern Brooklyn, and large portions of Staten Island — neighborhoods that experience more limited access to public transit and depend more heavily on private vehicles.
The transit desert map highlights the geographic inequalities in transit access across the city. Neighborhoods located within 0.5 miles of subway stations tend to be more densely populated and closer to the urban core. In contrast, neighborhoods without nearby subway access tend to have lower-density development patterns, longer commute times, and reduced accessibility to employment opportunities and services.

Transit Deserts in New York City — census tracts located 0.5 miles or more from a subway station. Orange areas indicate transit deserts; purple dots represent subway stations. Source: ACS data via Social Explorer.
The questions that emerge from this analysis relate to urban planning and how transportation infrastructure is designed. If the city only takes population density into account, there will likely continue to be an overlap of multiple transportation options in already dense areas.
Instead, it may be important to think more strategically about how to improve access to the urban core for residents living outside the most densely populated neighborhoods — particularly in ways that help reduce reliance on private transportation and address the structural inequities embedded in NYC's transit network.